Install Collectd
# CentOS 7.x
yum install epel-release.noarch -y
yum install libmicrohttpd collectd nc -y

OR
# CentOS 6.x
yum -y install libcurl libcurl-devel rrdtool rrdtool-devel rrdtool-prel libgcrypt-devel gcc make gcc-c++
wget http://collectd.org/files/collectd-5.4.0.tar.gz
tar zxvf collectd-5.4.0.tar.gz
cd collectd-5.4.0
./configure --prefix=/usr --sysconfdir=/etc --localstatedir=/var --libdir=/usr/lib --mandir=/usr/share/man --enable-all-plugins
make && make install

# Copy the default init.d script
cp /root/collectd-5.4.0/contrib/redhat/init.d-collectd /etc/init.d/collectd

# Set the correct permissions
chmod +x /etc/init.d/collectd
Custom Configuration Collectd
change the configuration as below on /etc/collectd.conf or remove symbol “#”
nano /etc/collectd.conf
Hostname "isi.hostname.nya"

LoadPlugin cpu
LoadPlugin interface
LoadPlugin load
LoadPlugin memory

LoadPlugin df
LoadPlugin disk
LoadPlugin processes
LoadPlugin exec
LoadPlugin write_graphite
add the configuration as below in the plugins section
<Plugin cpu>
#  ReportByCpu true
#  ReportByState true
  ValuesPercentage true
#  ReportNumCpu false
#  ReportGuestState false
#  SubtractGuestState true
</Plugin>

<Plugin df>
#       Device "/dev/hda1"
#       Device "192.168.0.2:/mnt/nfs"
#       MountPoint "/home"
#       FSType "ext3"
#	IgnoreSelected false
#       ReportByDevice false
#       ReportInodes false
#       ValuesAbsolute true
       	ValuesPercentage true
</Plugin>

<Plugin write_graphite>
  <Node "localhost">
    Host "grafana.mcs.co.id"
#    Port "2003"
#    Protocol "tcp"
#    ReconnectInterval 0
#    LogSendErrors true
    Prefix "collectd."
#    Postfix "collectd"
#    StoreRates true
#    AlwaysAppendDS false
#    EscapeCharacter "_"
#    SeparateInstances false
#    PreserveSeparator false
#    DropDuplicateFields false
  </Node>
</Plugin>

<Plugin exec>
#	Exec "user:group" "/path/to/exec"
       Exec "mail:mail" "/etc/collectd.d/exim-check-queue.sh"
#       NotificationExec "user:group" "/path/to/exec"
</Plugin>
nano /etc/collectd.d/exim-check-queue.sh
#!/bin/bash

instant="host_name_co_id"  ### change "." to "_" ###
server="ip atau domain server"

while true; do
  echo "crontab.$instant.exim-queue `exim -bpc` `/bin/date +%s`"  | nc $server 2003
  echo "crontab.$instant.exim-queue-frozen `exim -bp | grep "*** frozen ***" | wc -l` `/bin/date +%s`"  | nc $server 2003

  hariini=$(date +%Y-%m-%d)
  jam=$(date +%H)
  sum=$(cat /var/log/exim_mainlog | grep "$hariini $jam" | awk '$3 ~ /^cwd/{print $3}' | sort | uniq -c | sed "s|^ *||g" | sort -nr | head --lines 15 | egrep -v 'cwd=(/$|/etc/csf|/var/spool/exim|/var/lib/collectd|/tmp|/root|/var/spool/anacron|/etc/collectd.d|/usr/local/cpanel/whostmgr/docroot)' | awk '{print $1}')

  if [ "$a" != "0" ]; then
	a=0
  fi

  while read -r line; do
	a=$((a + line))
  done <<< "$sum"

  echo "crontab.$instant.exim-file $a `/bin/date +%s`" | nc $server 2003
  sleep 60
done
chown mail:mail /etc/collectd.d/exim-check-queue.sh
chmod +x /etc/collectd.d/exim-check-queue.sh
Start and enable startup daemon
# CentOS 7.x
systemctl enable collectd
systemctl start collectd
# CentOS 6.x
service collectd start
chkconfig collectd on
Grafana Setup
Login to grafana dashboard
Fill in the contents below into the Create menu => Import
{
"annotations": {
"list": [
{
"$$hashKey": "object:6372",
"builtIn": 1,
"datasource": "-- Grafana --",
"enable": true,
"hide": true,
"iconColor": "rgba(0, 211, 255, 1)",
"name": "Annotations & Alerts",
"type": "dashboard"
}
]
},
"editable": true,
"gnetId": null,
"graphTooltip": 1,
"id": 4,
"iteration": 1614574322012,
"links": [],
"panels": [
{
"aliasColors": {
"1.steal": "#E24D42",
"steal": "#E24D42"
},
"bars": false,
"dashLength": 10,
"dashes": false,
"datasource": "Graphite",
"editable": true,
"error": false,
"fieldConfig": {
"defaults": {
"custom": {},
"links": []
},
"overrides": []
},
"fill": 2,
"fillGradient": 0,
"grid": {},
"gridPos": {
"h": 8,
"w": 7,
"x": 0,
"y": 0
},
"hiddenSeries": false,
"id": 15,
"legend": {
"alignAsTable": true,
"avg": true,
"current": true,
"hideZero": false,
"max": false,
"min": false,
"rightSide": false,
"show": true,
"total": false,
"values": true
},
"lines": true,
"linewidth": 2,
"links": [],
"nullPointMode": "connected",
"options": {
"alertThreshold": true
},
"percentage": false,
"pluginVersion": "7.4.2",
"pointradius": 5,
"points": false,
"renderer": "flot",
"seriesOverrides": [],
"spaceLength": 10,
"stack": true,
"steppedLine": false,
"targets": [
{
"refId": "A",
"target": "collectd.$server.*.percent-system"
}
],
"thresholds": [],
"timeFrom": null,
"timeRegions": [],
"timeShift": null,
"title": "CPU Average",
"tooltip": {
"msResolution": false,
"shared": true,
"sort": 0,
"value_type": "individual"
},
"type": "graph",
"xaxis": {
"buckets": null,
"mode": "time",
"name": null,
"show": true,
"values": []
},
"yaxes": [
{
"$$hashKey": "object:1361",
"format": "percent",
"logBase": 1,
"max": null,
"min": 0,
"show": true
},
{
"$$hashKey": "object:1362",
"format": "short",
"logBase": 1,
"max": null,
"min": null,
"show": true
}
],
"yaxis": {
"align": false,
"alignLevel": null
}
},
{
"aliasColors": {},
"bars": false,
"dashLength": 10,
"dashes": false,
"datasource": "Graphite",
"editable": true,
"error": false,
"fieldConfig": {
"defaults": {
"custom": {},
"links": []
},
"overrides": []
},
"fill": 1,
"fillGradient": 0,
"grid": {},
"gridPos": {
"h": 8,
"w": 4,
"x": 7,
"y": 0
},
"hiddenSeries": false,
"id": 4,
"legend": {
"alignAsTable": true,
"avg": true,
"current": true,
"max": true,
"min": true,
"rightSide": false,
"show": true,
"sideWidth": null,
"total": false,
"values": true
},
"lines": true,
"linewidth": 2,
"links": [],
"nullPointMode": "connected",
"options": {
"alertThreshold": true
},
"percentage": false,
"pluginVersion": "7.4.2",
"pointradius": 5,
"points": false,
"renderer": "flot",
"seriesOverrides": [],
"spaceLength": 10,
"stack": false,
"steppedLine": false,
"targets": [
{
"refCount": 0,
"refId": "B",
"target": "alias(collectd.$server.processes.fork_rate, 'Rate')"
}
],
"thresholds": [],
"timeFrom": null,
"timeRegions": [],
"timeShift": null,
"title": "Processes",
"tooltip": {
"msResolution": false,
"shared": true,
"sort": 0,
"value_type": "cumulative"
},
"type": "graph",
"xaxis": {
"buckets": null,
"mode": "time",
"name": null,
"show": true,
"values": []
},
"yaxes": [
{
"$$hashKey": "object:594",
"format": "short",
"logBase": 1,
"max": null,
"min": null,
"show": true
},
{
"$$hashKey": "object:595",
"format": "short",
"logBase": 1,
"max": null,
"min": null,
"show": true
}
],
"yaxis": {
"align": false,
"alignLevel": null
}
},
{
"alert": {
"alertRuleTags": {},
"conditions": [
{
"evaluator": {
"params": [
30
],
"type": "gt"
},
"operator": {
"type": "and"
},
"query": {
"params": [
"C",
"5m",
"now"
]
},
"reducer": {
"params": [],
"type": "avg"
},
"type": "query"
}
],
"executionErrorState": "alerting",
"for": "5m",
"frequency": "1m",
"handler": 1,
"message": "Load Avarage lebih dari 5.0 coba di cek",
"name": "Load alert",
"noDataState": "no_data",
"notifications": []
},
"aliasColors": {},
"bars": false,
"dashLength": 10,
"dashes": false,
"datasource": "Graphite",
"editable": true,
"error": false,
"fieldConfig": {
"defaults": {
"custom": {},
"links": []
},
"overrides": []
},
"fill": 1,
"fillGradient": 0,
"grid": {},
"gridPos": {
"h": 8,
"w": 9,
"x": 11,
"y": 0
},
"hiddenSeries": false,
"id": 3,
"legend": {
"alignAsTable": true,
"avg": true,
"current": true,
"max": true,
"min": true,
"rightSide": false,
"show": true,
"total": false,
"values": true
},
"lines": true,
"linewidth": 2,
"links": [],
"nullPointMode": "connected",
"options": {
"alertThreshold": true
},
"percentage": false,
"pluginVersion": "7.4.2",
"pointradius": 5,
"points": false,
"renderer": "flot",
"seriesOverrides": [],
"spaceLength": 10,
"stack": false,
"steppedLine": false,
"targets": [
{
"refCount": 0,
"refId": "A",
"target": "alias(collectd.host_name_nya.*.load.longterm, 'Long')"
},
{
"refCount": 0,
"refId": "B",
"target": "alias(collectd.host_name_nya.*.load.midterm, 'Middle')"
},
{
"refCount": 0,
"refId": "C",
"target": "alias(collectd.host_name_nya.*.load.shortterm, 'Short')"
}
],
"thresholds": [
{
"colorMode": "critical",
"fill": true,
"line": true,
"op": "gt",
"value": 30,
"visible": true
}
],
"timeFrom": null,
"timeRegions": [],
"timeShift": null,
"title": "Load",
"tooltip": {
"msResolution": false,
"shared": true,
"sort": 0,
"value_type": "individual"
},
"type": "graph",
"xaxis": {
"buckets": null,
"mode": "time",
"name": null,
"show": true,
"values": []
},
"yaxes": [
{
"$$hashKey": "object:894",
"format": "short",
"logBase": 1,
"max": null,
"min": null,
"show": true
},
{
"$$hashKey": "object:895",
"format": "short",
"logBase": 1,
"max": null,
"min": null,
"show": true
}
],
"yaxis": {
"align": false,
"alignLevel": null
}
},
{
"alert": {
"alertRuleTags": {},
"conditions": [
{
"evaluator": {
"params": [
90
],
"type": "gt"
},
"operator": {
"type": "and"
},
"query": {
"params": [
"A",
"5m",
"now"
]
},
"reducer": {
"params": [],
"type": "avg"
},
"type": "query"
},
{
"evaluator": {
"params": [
90
],
"type": "gt"
},
"operator": {
"type": "or"
},
"query": {
"params": [
"B",
"5m",
"now"
]
},
"reducer": {
"params": [],
"type": "avg"
},
"type": "query"
}
],
"executionErrorState": "alerting",
"for": "3h",
"frequency": "30m",
"handler": 1,
"message": "Disk Usage lebih dari 90%",
"name": "Disk Usage Alert",
"noDataState": "no_data",
"notifications": []
},
"aliasColors": {},
"bars": false,
"dashLength": 10,
"dashes": false,
"datasource": "Graphite",
"editable": true,
"error": false,
"fieldConfig": {
"defaults": {
"custom": {},
"links": []
},
"overrides": []
},
"fill": 1,
"fillGradient": 0,
"grid": {},
"gridPos": {
"h": 8,
"w": 4,
"x": 20,
"y": 0
},
"hiddenSeries": false,
"id": 2,
"legend": {
"alignAsTable": false,
"avg": false,
"current": true,
"max": false,
"min": false,
"rightSide": false,
"show": true,
"total": false,
"values": true
},
"lines": true,
"linewidth": 2,
"links": [],
"nullPointMode": "connected",
"options": {
"alertThreshold": true
},
"percentage": false,
"pluginVersion": "7.4.2",
"pointradius": 5,
"points": false,
"renderer": "flot",
"seriesOverrides": [],
"spaceLength": 10,
"stack": false,
"steppedLine": false,
"targets": [
{
"hide": false,
"refCount": 0,
"refId": "A",
"target": "alias(collectd.host_name_nya.df-home.percent_bytes-used, 'Home Usage')"
},
{
"hide": false,
"refCount": 0,
"refId": "B",
"target": "alias(collectd.host_name_nya.df-root.percent_bytes-used, 'Root Usage')"
}
],
"thresholds": [
{
"colorMode": "critical",
"fill": true,
"line": true,
"op": "gt",
"value": 90,
"visible": true
}
],
"timeFrom": null,
"timeRegions": [],
"timeShift": null,
"title": "Disk Usage",
"tooltip": {
"msResolution": true,
"shared": true,
"sort": 0,
"value_type": "individual"
},
"type": "graph",
"xaxis": {
"buckets": null,
"mode": "time",
"name": null,
"show": true,
"values": []
},
"yaxes": [
{
"$$hashKey": "object:1093",
"format": "percent",
"logBase": 1,
"max": 100,
"min": 0,
"show": true
},
{
"$$hashKey": "object:1094",
"format": "short",
"logBase": 1,
"max": null,
"min": null,
"show": true
}
],
"yaxis": {
"align": false,
"alignLevel": null
}
},
{
"aliasColors": {},
"bars": false,
"dashLength": 10,
"dashes": false,
"datasource": "Graphite",
"editable": true,
"error": false,
"fieldConfig": {
"defaults": {
"custom": {},
"links": []
},
"overrides": []
},
"fill": 1,
"fillGradient": 0,
"grid": {},
"gridPos": {
"h": 6,
"w": 6,
"x": 0,
"y": 8
},
"hiddenSeries": false,
"id": 8,
"legend": {
"alignAsTable": true,
"avg": true,
"current": true,
"max": false,
"min": false,
"show": true,
"total": false,
"values": true
},
"lines": false,
"linewidth": 2,
"links": [],
"nullPointMode": "connected",
"options": {
"alertThreshold": true
},
"percentage": false,
"pluginVersion": "7.4.2",
"pointradius": 1,
"points": true,
"renderer": "flot",
"seriesOverrides": [],
"spaceLength": 10,
"stack": false,
"steppedLine": false,
"targets": [
{
"refId": "A",
"target": "collectd.$server.*.disk_octets.write"
}
],
"thresholds": [],
"timeFrom": null,
"timeRegions": [],
"timeShift": null,
"title": "Write IOPS",
"tooltip": {
"msResolution": false,
"shared": true,
"sort": 0,
"value_type": "cumulative"
},
"type": "graph",
"xaxis": {
"buckets": null,
"mode": "time",
"name": null,
"show": true,
"values": []
},
"yaxes": [
{
"$$hashKey": "object:1233",
"format": "short",
"logBase": 1,
"max": null,
"min": null,
"show": true
},
{
"$$hashKey": "object:1234",
"format": "short",
"logBase": 1,
"max": null,
"min": null,
"show": true
}
],
"yaxis": {
"align": false,
"alignLevel": null
}
},
{
"aliasColors": {},
"bars": false,
"cacheTimeout": null,
"dashLength": 10,
"dashes": false,
"datasource": "Graphite",
"editable": true,
"error": false,
"fieldConfig": {
"defaults": {
"custom": {},
"links": []
},
"overrides": []
},
"fill": 1,
"fillGradient": 0,
"grid": {},
"gridPos": {
"h": 6,
"w": 6,
"x": 6,
"y": 8
},
"hiddenSeries": false,
"id": 7,
"legend": {
"alignAsTable": true,
"avg": true,
"current": true,
"max": true,
"min": false,
"rightSide": false,
"show": true,
"total": false,
"values": true
},
"lines": false,
"linewidth": 2,
"links": [],
"nullPointMode": "connected",
"options": {
"alertThreshold": true
},
"percentage": false,
"pluginVersion": "7.4.2",
"pointradius": 1,
"points": true,
"renderer": "flot",
"seriesOverrides": [],
"spaceLength": 10,
"stack": false,
"steppedLine": false,
"targets": [
{
"hide": false,
"refCount": 0,
"refId": "B",
"target": "collectd.$server.*.disk_octets.read",
"textEditor": false
}
],
"thresholds": [],
"timeFrom": null,
"timeRegions": [],
"timeShift": null,
"title": "Read IOPS",
"tooltip": {
"msResolution": false,
"shared": true,
"sort": 0,
"value_type": "cumulative"
},
"type": "graph",
"xaxis": {
"buckets": null,
"mode": "time",
"name": null,
"show": true,
"values": []
},
"yaxes": [
{
"$$hashKey": "object:1503",
"format": "short",
"logBase": 1,
"max": null,
"min": null,
"show": true
},
{
"$$hashKey": "object:1504",
"format": "short",
"logBase": 1,
"max": null,
"min": null,
"show": true
}
],
"yaxis": {
"align": false,
"alignLevel": null
}
},
{
"aliasColors": {},
"bars": false,
"cacheTimeout": null,
"dashLength": 10,
"dashes": false,
"datasource": "Graphite",
"editable": true,
"error": false,
"fieldConfig": {
"defaults": {
"custom": {},
"links": []
},
"overrides": []
},
"fill": 1,
"fillGradient": 0,
"grid": {},
"gridPos": {
"h": 6,
"w": 12,
"x": 12,
"y": 8
},
"hiddenSeries": false,
"id": 10,
"legend": {
"alignAsTable": true,
"avg": true,
"current": true,
"max": false,
"min": false,
"rightSide": true,
"show": true,
"total": false,
"values": true
},
"lines": true,
"linewidth": 2,
"links": [],
"nullPointMode": "connected",
"options": {
"alertThreshold": true
},
"percentage": false,
"pluginVersion": "7.4.2",
"pointradius": 5,
"points": false,
"renderer": "flot",
"seriesOverrides": [],
"spaceLength": 10,
"stack": true,
"steppedLine": false,
"targets": [
{
"refCount": 0,
"refId": "A",
"target": "alias(collectd.$server.memory.memory-buffered, 'Buffered')"
},
{
"refCount": 0,
"refId": "B",
"target": "alias(collectd.$server.memory.memory-cached, 'Cached')"
},
{
"refCount": 0,
"refId": "C",
"target": "alias(collectd.$server.memory.memory-free, 'Free')"
},
{
"refCount": 0,
"refId": "F",
"target": "alias(collectd.$server.memory.memory-used, 'Used')"
},
{
"refCount": 0,
"refId": "D",
"target": "alias(collectd.$server.memory.memory-slab_recl, 'Slab_recl')"
},
{
"refCount": 0,
"refId": "E",
"target": "alias(collectd.$server.memory.memory-slab_unrecl, 'Slab_unrecl')"
}
],
"thresholds": [],
"timeFrom": null,
"timeRegions": [],
"timeShift": null,
"title": "Memory Available",
"tooltip": {
"msResolution": true,
"shared": true,
"sort": 0,
"value_type": "individual"
},
"type": "graph",
"xaxis": {
"buckets": null,
"mode": "time",
"name": null,
"show": true,
"values": []
},
"yaxes": [
{
"$$hashKey": "object:1758",
"format": "bits",
"logBase": 1,
"max": null,
"min": 0,
"show": true
},
{
"$$hashKey": "object:1759",
"format": "short",
"logBase": 1,
"max": null,
"min": null,
"show": true
}
],
"yaxis": {
"align": false,
"alignLevel": null
}
},
{
"alert": {
"alertRuleTags": {},
"conditions": [
{
"evaluator": {
"params": [
100
],
"type": "gt"
},
"operator": {
"type": "and"
},
"query": {
"params": [
"B",
"5m",
"now"
]
},
"reducer": {
"params": [],
"type": "avg"
},
"type": "query"
},
{
"evaluator": {
"params": [
100
],
"type": "gt"
},
"operator": {
"type": "or"
},
"query": {
"params": [
"C",
"5m",
"now"
]
},
"reducer": {
"params": [],
"type": "avg"
},
"type": "query"
}
],
"executionErrorState": "alerting",
"for": "5m",
"frequency": "1m",
"handler": 1,
"message": "Halo Gan, dicek dong kayanya ada spam nih",
"name": "Exim Queue Alert Hostname",
"noDataState": "no_data",
"notifications": []
},
"aliasColors": {},
"bars": false,
"cacheTimeout": null,
"dashLength": 10,
"dashes": false,
"datasource": "Graphite",
"editable": true,
"error": false,
"fieldConfig": {
"defaults": {
"custom": {},
"links": []
},
"overrides": []
},
"fill": 1,
"fillGradient": 0,
"grid": {},
"gridPos": {
"h": 5,
"w": 12,
"x": 0,
"y": 14
},
"hiddenSeries": false,
"id": 17,
"legend": {
"alignAsTable": true,
"avg": true,
"current": true,
"max": true,
"min": true,
"rightSide": true,
"show": true,
"total": false,
"values": true
},
"lines": true,
"linewidth": 2,
"links": [],
"nullPointMode": "connected",
"options": {
"alertThreshold": true
},
"percentage": false,
"pluginVersion": "7.4.2",
"pointradius": 1,
"points": false,
"renderer": "flot",
"seriesOverrides": [],
"spaceLength": 10,
"stack": false,
"steppedLine": false,
"targets": [
{
"hide": false,
"refCount": 0,
"refId": "B",
"target": "alias(crontab.host_name_nya.exim-queue, 'Queue')",
"textEditor": false
},
{
"hide": false,
"refCount": 0,
"refId": "A",
"target": "alias(crontab.host_name_nya.exim-queue-frozen, 'Frozen')",
"textEditor": false
},
{
"hide": false,
"refCount": 0,
"refId": "C",
"target": "alias(crontab.host_name_nya.exim-file, 'PHPmailer')",
"textEditor": false
}
],
"thresholds": [
{
"colorMode": "critical",
"fill": true,
"line": true,
"op": "gt",
"value": 100,
"visible": true
}
],
"timeFrom": null,
"timeRegions": [],
"timeShift": null,
"title": "Exim Queue",
"tooltip": {
"msResolution": false,
"shared": true,
"sort": 0,
"value_type": "cumulative"
},
"type": "graph",
"xaxis": {
"buckets": null,
"mode": "time",
"name": null,
"show": true,
"values": []
},
"yaxes": [
{
"$$hashKey": "object:1932",
"format": "short",
"logBase": 1,
"max": null,
"min": null,
"show": true
},
{
"$$hashKey": "object:1933",
"format": "short",
"logBase": 1,
"max": null,
"min": null,
"show": true
}
],
"yaxis": {
"align": false,
"alignLevel": null
}
},
{
"aliasColors": {},
"bars": false,
"dashLength": 10,
"dashes": false,
"datasource": "Graphite",
"editable": true,
"error": false,
"fieldConfig": {
"defaults": {
"custom": {},
"links": []
},
"overrides": []
},
"fill": 1,
"fillGradient": 0,
"grid": {},
"gridPos": {
"h": 5,
"w": 6,
"x": 12,
"y": 14
},
"hiddenSeries": false,
"id": 16,
"legend": {
"avg": true,
"current": false,
"max": false,
"min": false,
"show": true,
"total": false,
"values": true
},
"lines": true,
"linewidth": 2,
"links": [],
"nullPointMode": "connected",
"options": {
"alertThreshold": true
},
"percentage": false,
"pluginVersion": "7.4.2",
"pointradius": 5,
"points": false,
"renderer": "flot",
"seriesOverrides": [
{
"$$hashKey": "object:2868",
"alias": "out",
"transform": "negative-Y"
}
],
"spaceLength": 10,
"stack": false,
"steppedLine": false,
"targets": [
{
"refCount": 0,
"refId": "A",
"target": "alias(scale(perSecond(collectd.$server.interface-ens32.if_packets.rx), 8), ' In')",
"textEditor": false
},
{
"refCount": 0,
"refId": "B",
"target": "alias(scale(perSecond(collectd.$server.interface-ens32.if_packets.tx), 8), 'Out')",
"textEditor": false
}
],
"thresholds": [],
"timeFrom": null,
"timeRegions": [],
"timeShift": null,
"title": "Packet Traffic/sec",
"tooltip": {
"msResolution": true,
"shared": true,
"sort": 0,
"value_type": "cumulative"
},
"type": "graph",
"xaxis": {
"buckets": null,
"mode": "time",
"name": null,
"show": true,
"values": []
},
"yaxes": [
{
"$$hashKey": "object:2881",
"format": "bps",
"logBase": 1,
"max": null,
"min": null,
"show": true
},
{
"$$hashKey": "object:2882",
"format": "short",
"logBase": 1,
"max": null,
"min": null,
"show": true
}
],
"yaxis": {
"align": false,
"alignLevel": null
}
},
{
"aliasColors": {},
"bars": false,
"dashLength": 10,
"dashes": false,
"datasource": "Graphite",
"editable": true,
"error": false,
"fieldConfig": {
"defaults": {
"custom": {},
"links": []
},
"overrides": []
},
"fill": 1,
"fillGradient": 0,
"grid": {},
"gridPos": {
"h": 5,
"w": 6,
"x": 18,
"y": 14
},
"hiddenSeries": false,
"id": 9,
"legend": {
"avg": true,
"current": false,
"max": false,
"min": false,
"show": true,
"total": false,
"values": true
},
"lines": true,
"linewidth": 2,
"links": [],
"nullPointMode": "connected",
"options": {
"alertThreshold": true
},
"percentage": false,
"pluginVersion": "7.4.2",
"pointradius": 5,
"points": false,
"renderer": "flot",
"seriesOverrides": [
{
"$$hashKey": "object:3048",
"alias": "out",
"transform": "negative-Y"
}
],
"spaceLength": 10,
"stack": false,
"steppedLine": false,
"targets": [
{
"refCount": 0,
"refId": "A",
"target": "alias(scale(perSecond(collectd.$server.interface-ens32.if_octets.rx), 8), 'In')",
"textEditor": false
},
{
"refCount": 0,
"refId": "B",
"target": "alias(scale(perSecond(collectd.$server.interface-ens32.if_octets.tx), 8), 'Out')",
"textEditor": false
}
],
"thresholds": [],
"timeFrom": null,
"timeRegions": [],
"timeShift": null,
"title": "Network Traffic/sec",
"tooltip": {
"msResolution": true,
"shared": true,
"sort": 0,
"value_type": "cumulative"
},
"type": "graph",
"xaxis": {
"buckets": null,
"mode": "time",
"name": null,
"show": true,
"values": []
},
"yaxes": [
{
"$$hashKey": "object:3061",
"format": "bps",
"logBase": 1,
"max": null,
"min": null,
"show": true
},
{
"$$hashKey": "object:3062",
"format": "short",
"logBase": 1,
"max": null,
"min": null,
"show": true
}
],
"yaxis": {
"align": false,
"alignLevel": null
}
}
],
"refresh": "5m",
"schemaVersion": 27,
"style": "dark",
"tags": [
"collectd"
],
"templating": {
"list": [
{
"allFormat": "glob",
"datasource": null,
"description": null,
"error": null,
"hide": 2,
"includeAll": false,
"label": "",
"multi": false,
"multiFormat": "glob",
"name": "server",
"query": "host_name_nya",
"refresh": 0,
"refresh_on_load": false,
"skipUrlSync": false,
"type": "constant"
}
]
},
"time": {
"from": "now-30m",
"to": "now"
},
"timepicker": {
"now": true,
"refresh_intervals": [
"5s",
"10s",
"30s",
"1m",
"5m",
"15m",
"30m",
"1h",
"2h",
"1d"
],
"time_options": [
"5m",
"15m",
"1h",
"6h",
"12h",
"24h",
"2d",
"7d",
"30d"
]
},
"timezone": "browser",
"title": "nama.tittle.nya",
"uid": "kasjhkjahsd92",
"version": 60
}
Klik Load

In this section, fill in “name” according to your wishes & in the “Unique identifier (uid)” can be left blank.

Once created, then get to the Dashboard settings


Select the “Variable” in the “Contans” “Value” is changed as the setting in the collectd and then click update

Save Dashboard

Check the “Save current variable values as dashboard default” section then click “Save”

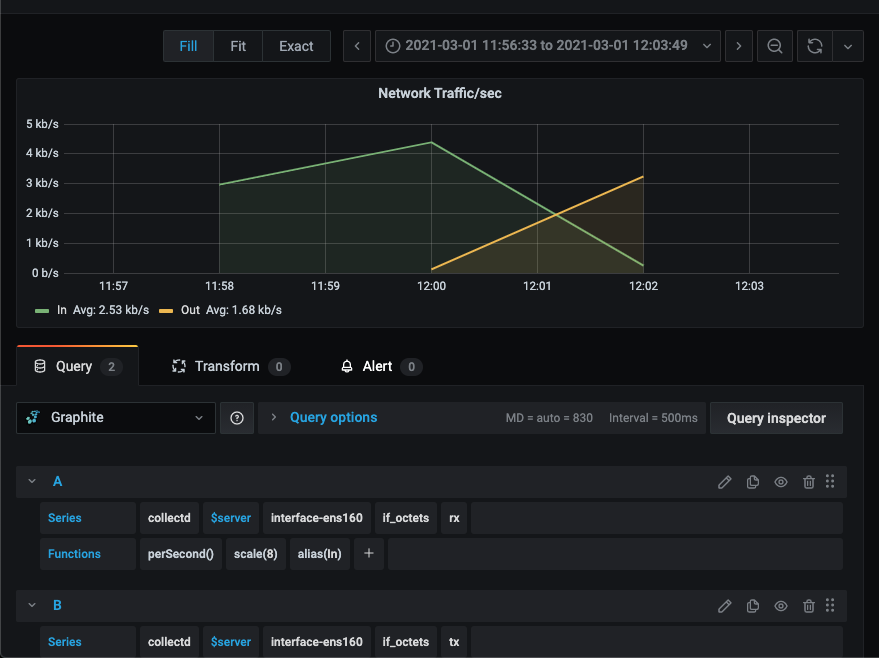
Setting section “Load” and click edit


Disk Usage


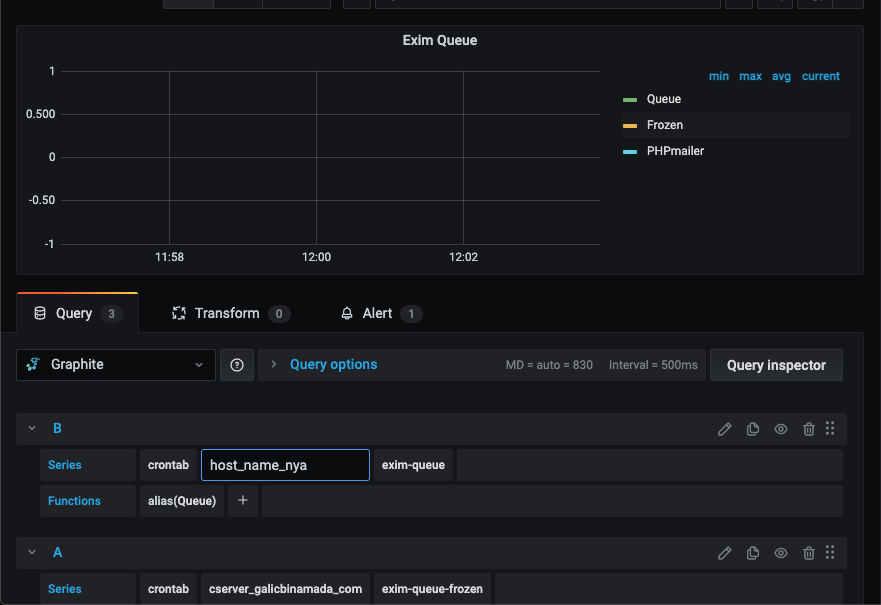
Exim Queue


Done